Decision Support · Risk Analysis · Geospatial Visualization
Dynamic Building Risk Analysis
A configurable dashboard for exploring how building characteristics, hazard scenarios, annual probabilities, and financial assumptions influence scenario-based risk estimates.
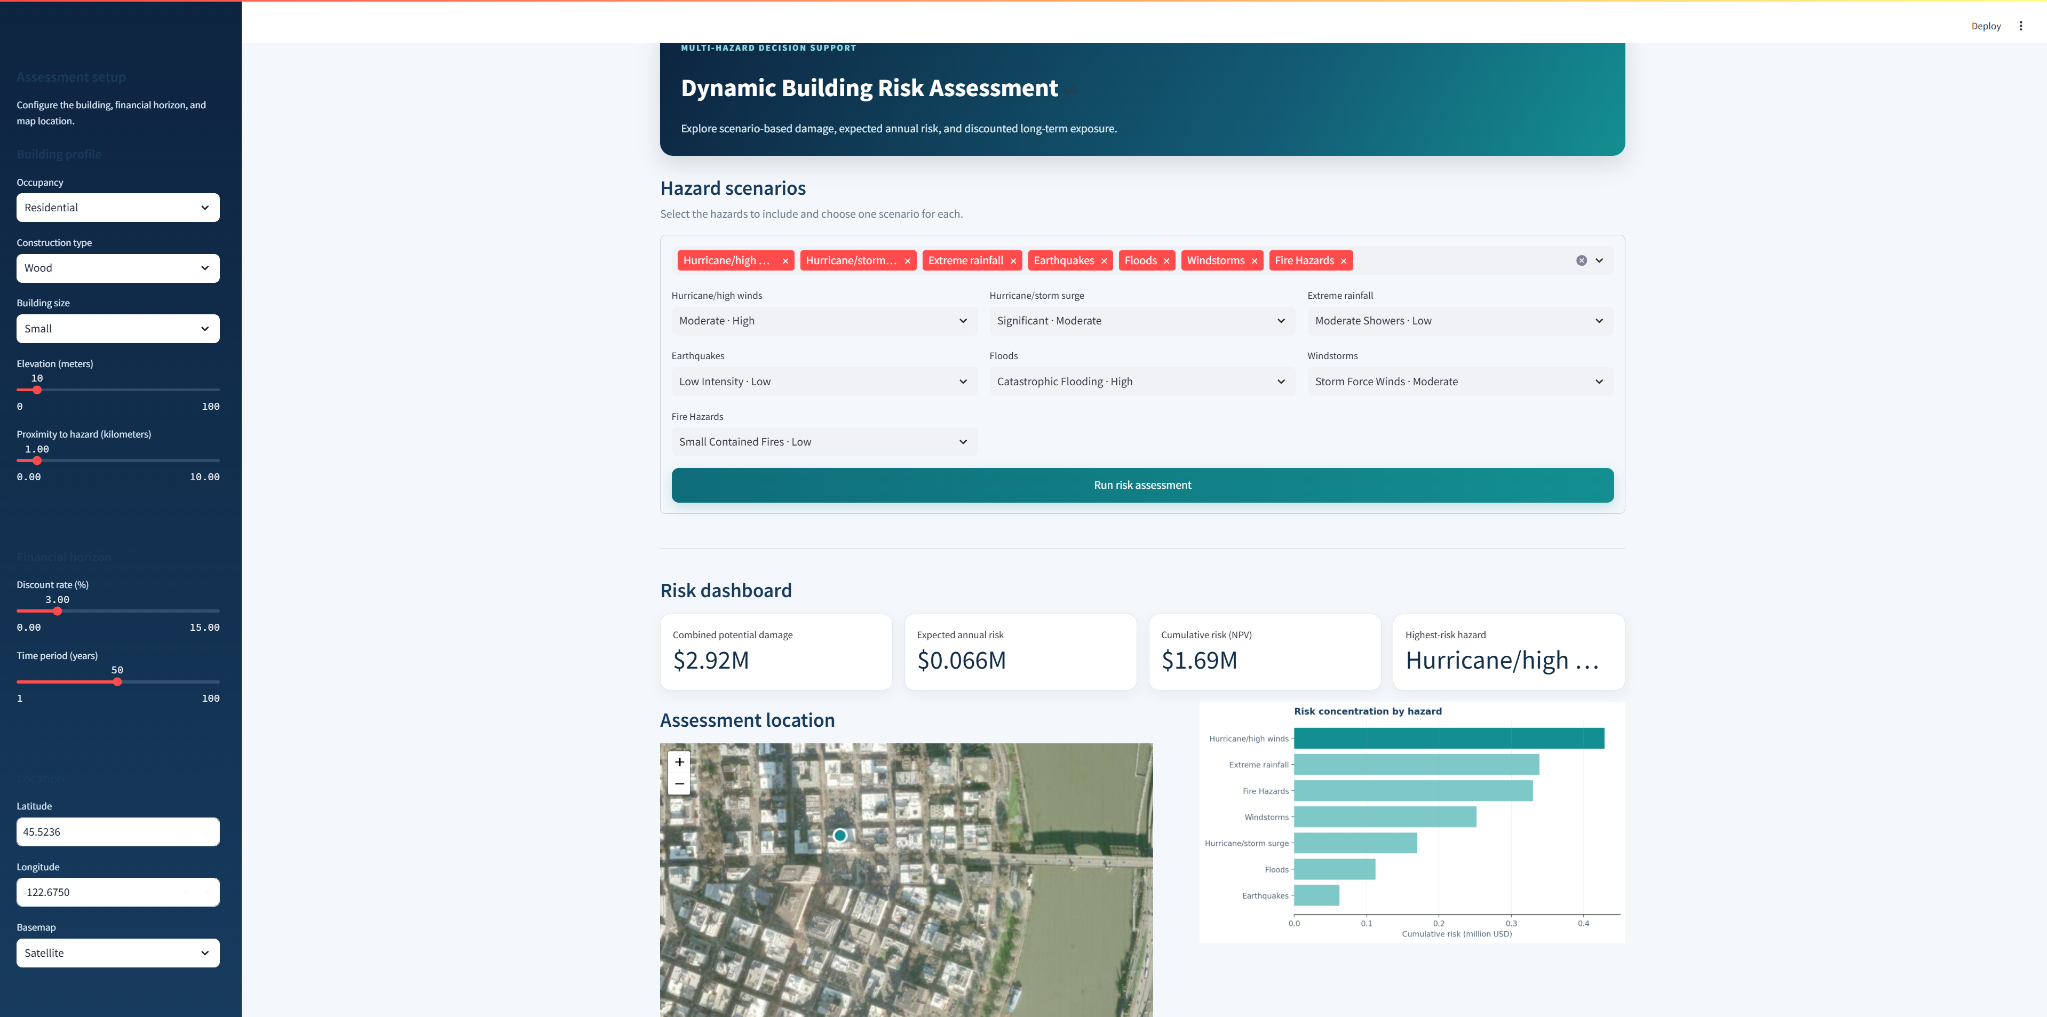
Project purpose
Building-risk decisions often require users to consider several hazard types, physical characteristics, location information, and long-term financial effects together. This project demonstrates how those inputs can be organized into one interactive screening workflow.
The application was developed as an early Ph.D. proof of concept and later refreshed for reliable demonstration and portfolio presentation. The original scenario assumptions and calculation structure were preserved while the interface, mapping workflow, visual hierarchy, and reproducibility documentation were improved.
Assessment workflow
Building profile
Users configure occupancy, construction type, building size, elevation, and proximity to the hazard source.
Hazard scenarios
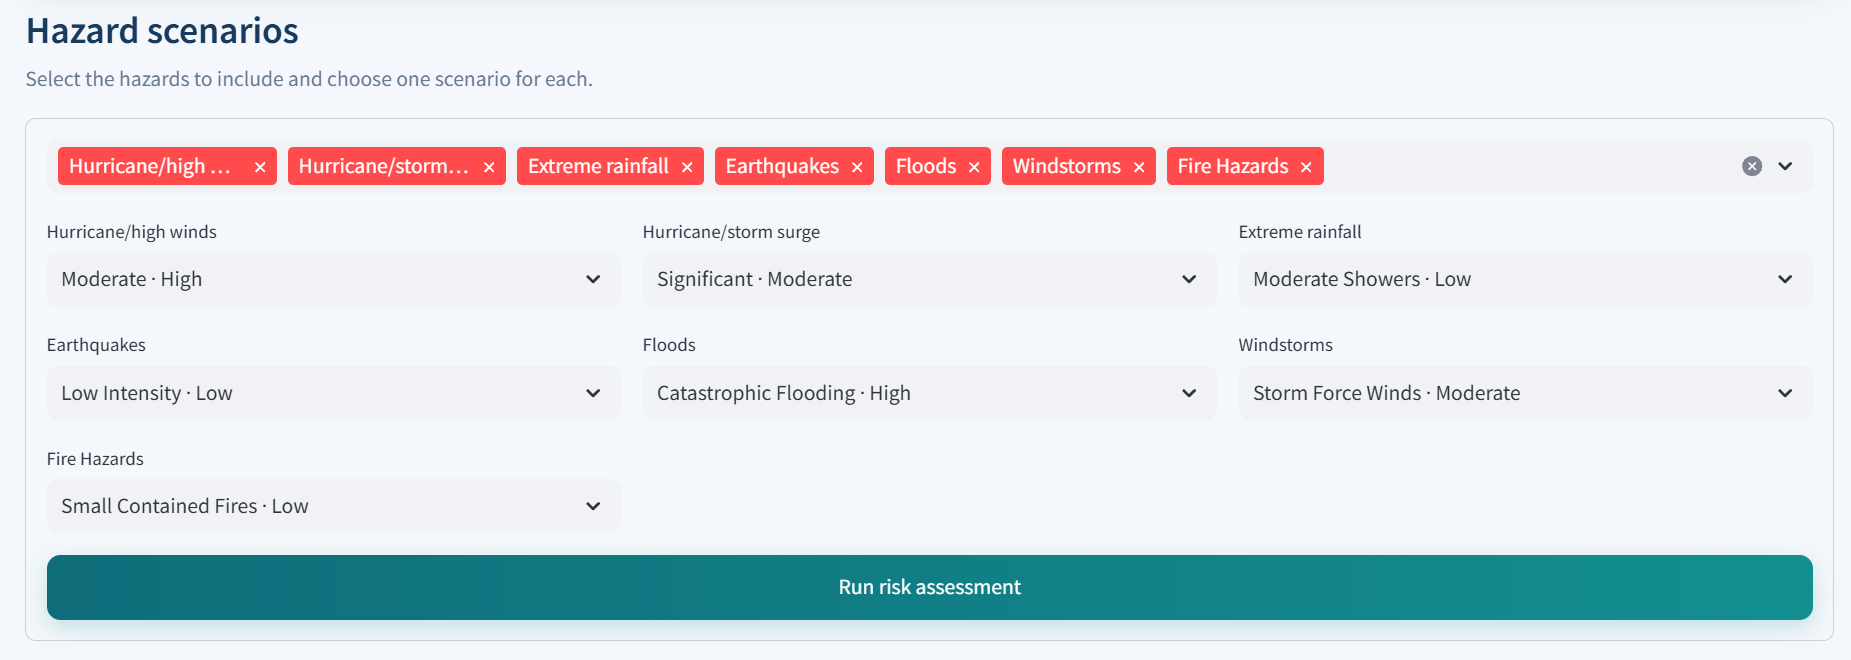
The assessment supports hurricanes, storm surge, rainfall, earthquakes, floods, windstorms, snow and ice, landslides, and fire hazards.
Financial horizon
A discount rate and planning period convert expected annual risk into discounted cumulative exposure.
Geospatial context
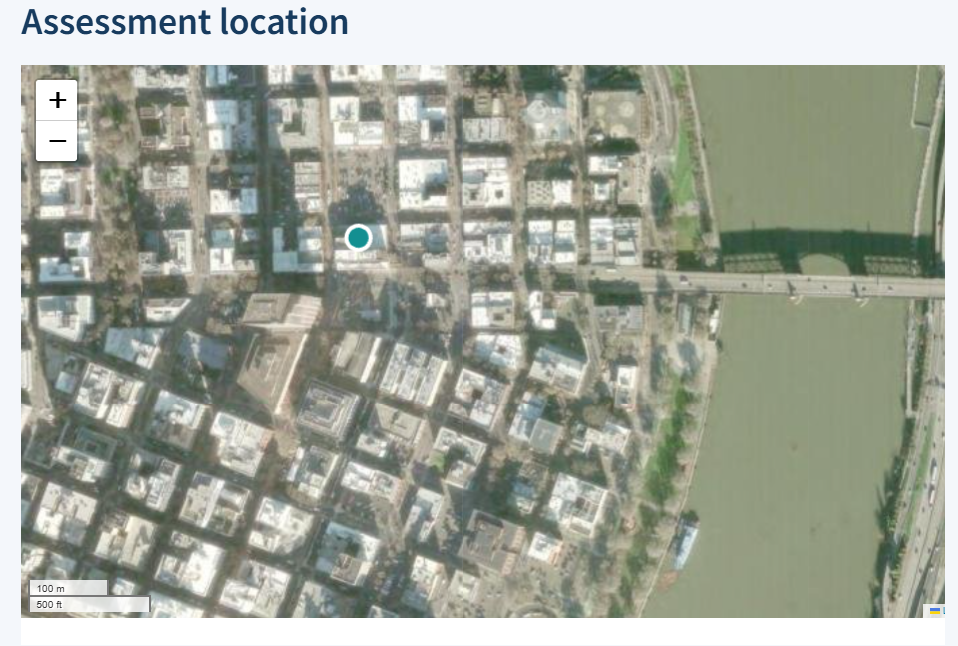
Satellite and OpenStreetMap basemaps show the assessment location, with an optional MapLibre-based 3D view.
Scenario configuration
Risk calculations
Expected annual risk
Annual risk = scenario probability × potential damage
Discounted cumulative risk
NPV = sum of annual risk / (1 + discount rate)t
Potential damage begins with an occupancy- and severity-specific base value. The application then applies multipliers for building size, construction type, elevation, proximity, and the selected hazard type. Results are calculated independently for every selected scenario and aggregated for dashboard reporting.
Spatial and financial interpretation
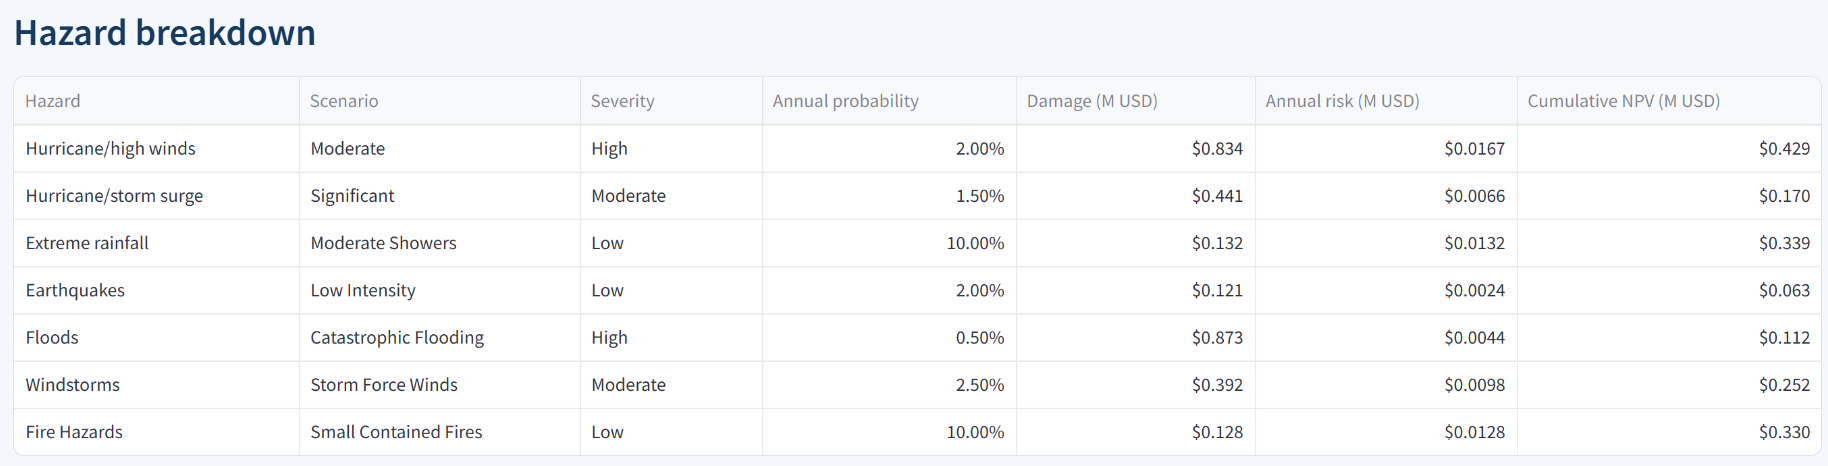
Detailed hazard breakdown
Technical implementation
- Streamlit provides the interactive building, hazard, financial, and location controls.
- Pandas structures the scenario results and prepares the detailed assessment table.
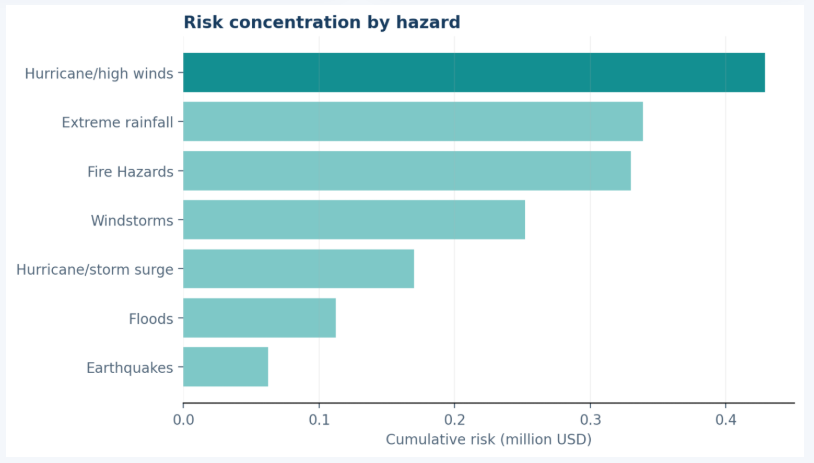
- Matplotlib creates the ranked cumulative-risk visualization.
- Folium and Streamlit-Folium provide satellite and OpenStreetMap views.
- LeafMap and MapLibre support an optional API-key-enabled 3D basemap.
- Session state preserves the latest completed assessment while users inspect the resulting dashboard.
Illustrative dashboard result
In the configuration shown above, seven hazards produce approximately $2.92 million in combined potential damage, $0.066 million in expected annual risk, and $1.69 million in discounted cumulative risk over the selected horizon. Hurricane and high-wind exposure is the largest contributor in this illustrative scenario.
These values demonstrate the application's calculation and visualization workflow. They are not general conclusions about the mapped location or any real building.
Responsible interpretation
This application is a scenario-based educational prototype. Its probabilities, base damage values, multipliers, and hazard relationships are project assumptions rather than calibrated, site-specific engineering estimates. The map provides location context but does not retrieve authoritative hazard data for the selected coordinates.
The results should not be used for structural safety, insurance, emergency management, investment, or other real-world risk decisions.