Biomedical Signal Analysis · Graph Machine Learning · Sleep Research
Machine Learning-Based Polysomnography Data Analysis for ADHD Diagnosis: A Focus on Sleep Stage-Based Biomarkers
Proceedings of the 2025 IEEE 22nd International Symposium on Biomedical Imaging (ISBI 2025)
Research motivation
ADHD assessment commonly relies on behavioral observations, questionnaires, and clinical judgment. These sources are important, but they can vary across observers and settings. The study investigated whether physiological relationships measured during sleep could provide complementary, objectively derived biomarkers.
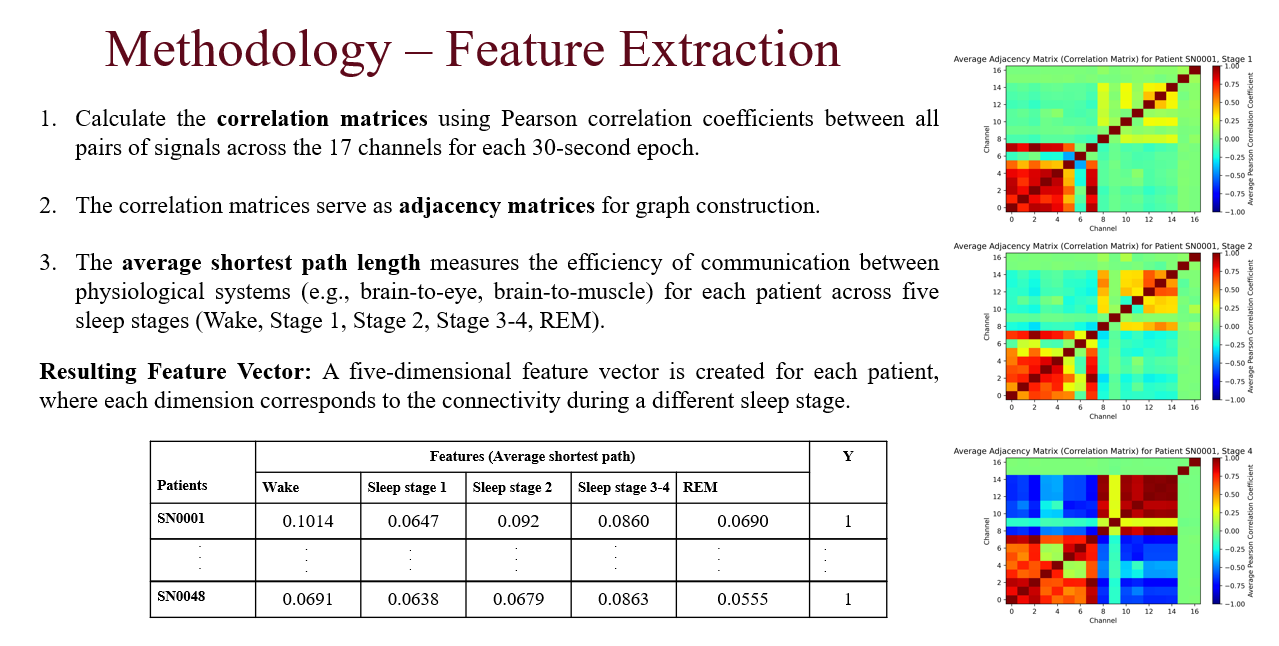
Polysomnography records several interacting physiological systems throughout sleep. Rather than analyzing each signal independently, the project models relationships among EEG, EOG, EMG, and ECG channels as weighted networks and examines how those relationships vary across sleep stages.
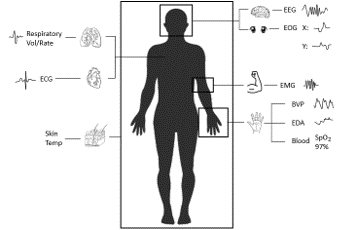
Study cohort and polysomnography data
The study included 48 participants between 6 and 18 years of age: 25 participants with ADHD and 23 control participants. Each participant contributed approximately eight hours of PSG recordings acquired through the University of Mississippi Medical Center Pediatric Sleep Center.
The analysis included 20,294 ADHD epochs and 19,968 control epochs. Every 30-second epoch was sampled at 512 Hz across 17 channels: eight EEG channels, two EOG channels, five EMG channels, and two ECG channels. The recordings were organized across Wake, Sleep Stage 1, Sleep Stage 2, Sleep Stage 3-4, and rapid eye movement sleep.
Graph-based feature extraction
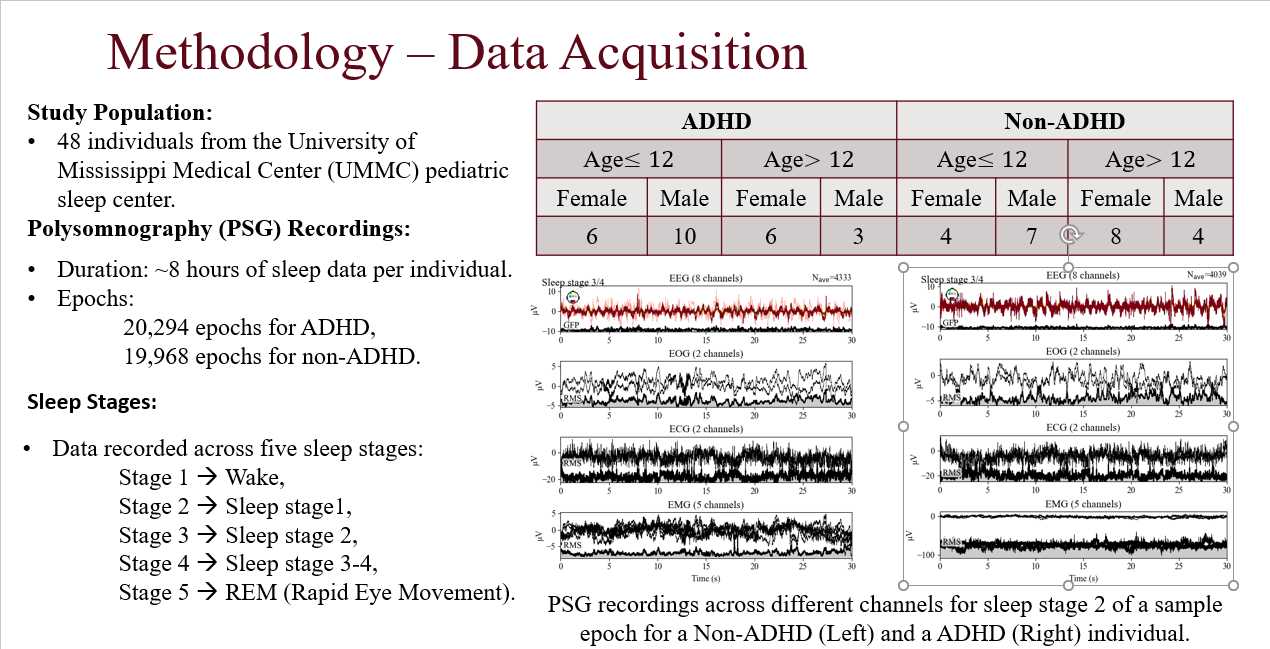
For each 30-second epoch, the workflow calculates Pearson correlation coefficients between all pairs of the 17 physiological channels. Absolute correlation matrices are averaged for each participant and sleep stage and represented as weighted NetworkX graphs.
Weighted shortest paths are calculated from each stage-specific graph, and their average provides one graph feature. The five sleep-stage features form a compact participant-level representation used by the machine-learning model.
The public repository preserves the historical implementation exactly, including its use of absolute correlations directly as graph edge weights. It also provides a cleaned and tested Python package that separates data handling, graph construction, feature extraction, batch processing, modeling, and evaluation.
Machine-learning evaluation
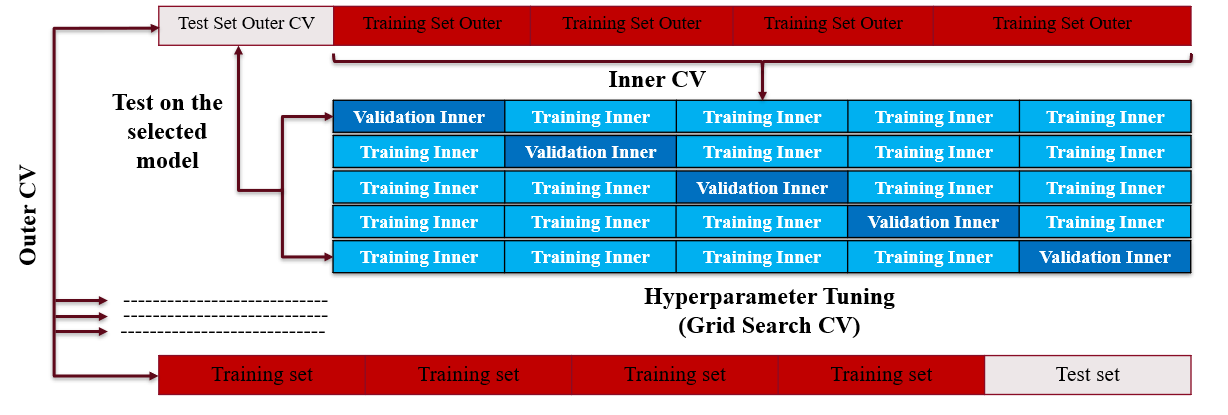
A Random Forest classifier evaluates the five-dimensional participant representation. The historical workflow uses an outer five-fold cross-validation loop for testing and an inner five-fold GridSearchCV loop for hyperparameter selection. The search considers the number of trees, tree depth, minimum split size, and minimum leaf size.
Published results
The reported average Random Forest performance was:
- Accuracy: 72%
- Precision: 71%
- Recall: 85%
- F1 score: 76%
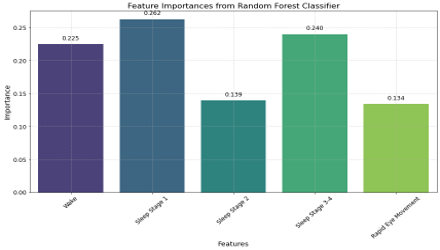
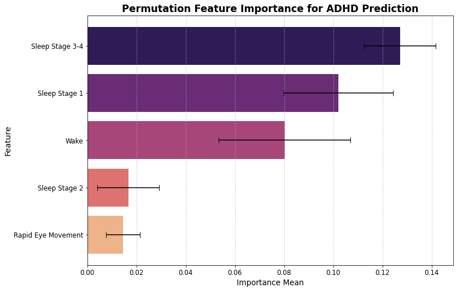
Random Forest feature importance and permutation importance both identified Sleep Stage 1 and Sleep Stage 3-4 as the most influential stage-level features. The result suggests that graph-based physiological connectivity during light and deeper sleep contains information relevant to differentiating the two study groups.
Reproducible research software
The public repository contains the preserved publication-era scripts, a reusable Python package, command-line interfaces, historical configurations, automated tests, continuous-integration validation, machine-readable publication results, and a complete synthetic PSG demonstration.
The original participant-level PSG recordings are protected clinical data and are not publicly distributed. The synthetic demonstration is provided only to validate that the software runs end to end. Synthetic metrics and feature importances have no clinical or publication-level interpretation.
Interpretation and limitations
The study used a limited cohort and should not be interpreted as a general-purpose clinical diagnostic system. The repository also documents historical methodological choices, including batch-level stage imputation, sign-inversion augmentation before cross-validation, direct use of correlation values as shortest-path weights, and unseeded stochastic components.
These behaviors are preserved for scientific provenance rather than silently replaced. The reported metrics are maintained as the publication record and are not presented as deterministic regenerations from the public synthetic data.
Project support
System Intelligence and Optimization Lab